Open the Monitor tool of the Netscape Application Server Administrator.

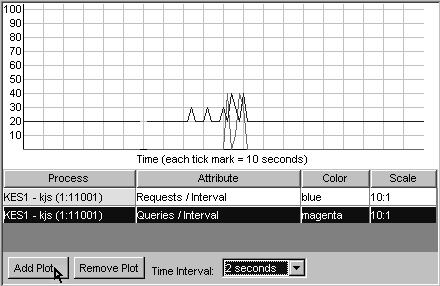
The Monitor tool appears.
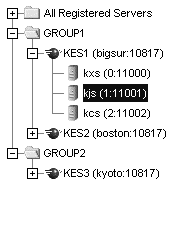
In the Enterprise window, select the process for which you want to chart an attribute.

Under the chart, click Add Plot.

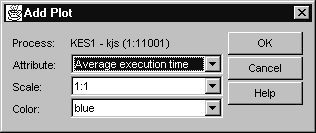
The Add Plot dialog box appears.

In Attribute, select the attribute you want to chart
For more information about the attributes, see "About the Process
Attributes."
In Scale, choose the scale at which you want the attribute plotted.
Values range from 10:1 to 1:1,000,000.
In Color, choose a distinguishable color for the process attribute.
Repeat steps 2 through 6 for each process or attribute you want to chart.
Click OK.
The process data plot is added to the chart.