Administration Guide
Overview Guide
Installation Guide
Previous Next Contents


Changing a Process Data Plot
Once a process data plot is added to the Monitor tool chart, you can quickly and easily adjust that plot. There is a row, under the chart, that pertains to each process attribute currently being plotted. The Attribute, Color, and Scale characteristics for each plot are editable drop down boxes. This allows for easy adjusting of the process plot.

To change the attribute of a plot

  1. Open the Monitor tool of the Netscape Application Server Administrator.
  2. Under the chart, select the process you want to change.
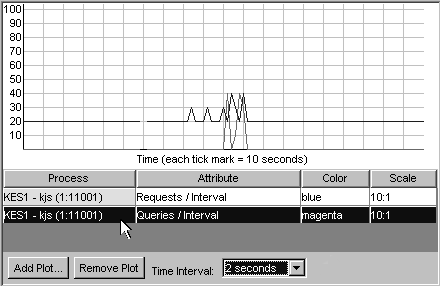
  3. To change the attribute, click the Attribute box.
  4. A list box with the available attributes appears.
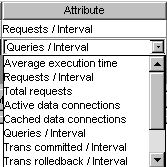
  5. Select the new attribute to be charted.
  6. The list box closes and the new attribute is charted, starting at the next update specified by the interval.

  7. To change the color or scale of the plot, repeat steps 3 and 4 clicking in the color or scale boxes.
  8. To change the interval at which the plot is updated, select a new time from the Interval list box.
 

© Copyright 1998 Netscape Communications Corporation